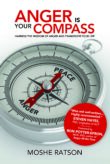
Practicing psychotherapist and anger expert Moshe Ratson shows readers how to use their anger as a tool for personal transformation.
Anger Is Your Compass
Client Reviews
On the brink of divorce, spiral2grow therapist helped us save our marriage. We still have challenges, yet we are committed to handle them. Our therapist gave us the ability to create a healthy and happy marriage richer than either of us ever imagined. It was the hardest thing we have ever done, a... Couples Therapy
Moshe Ratson has become our resource in assisting our leaders to not only identify but correct and improve development areas. The coaching he has provided on an individual basis has given valuable insight and helped our staff gain perspective in terms of managing relationships, prioritizing, stra... Executive Coaching
It is great to to control the situation rather than be controlled by it. By applying the techniques that I have learned from your anger management classes, I am able to recognize my own negative self talk. Now, I am using your “formula” and taking the time to be patient, rational and consider the... Anger Management
Over six months ago, I felt helpless and depressed about my job situation and convinced that the only thing possible was a total career transition. Then, I started working with Moshe. Through difficult, yet rewarding experience, I have explored and identify my needs. Within a few weeks, I realize... Career Coaching
“I have worked with some of the very best leadership coaches in the United States. I can say without hesitation that Moshe not only stands among them at the level of tactics and problem-solving but he also brings a level of understanding and insight about living authentically as a human being tha... Life Coaching
You provided us with practical tools & strategies to improve our communication, problem-solving skills and intimacy. You helped us build the foundation for our marriage. Now, we feel that we are growing together in a loving committed relationship. Relationship Coaching
No program has ever offered me such good and applicable relationship counseling. This workshop should be a pre-requisite for marriage or intimate relationship. Although we were in a group setting, it was very personal and private. I leave this group feeling renewed with a new understanding of my ... Workshops
By spiral2grow · Published November 13, 2026 · Data: CDC PLACES 2025 release (2023 survey data) and NYC Planning · More research
CDC estimates that 38.0% of Manhattan adults felt lonely at least sometimes in 2023. By community district, the estimate ranged from 35.2% on both the Upper East Side and the Upper West Side to between 42.5% and 42.8% in Central Harlem, Morningside and Hamilton Heights, and East Harlem. The estimated share lacking social and emotional support ranged from 21.7% on the Upper East Side to between 32.6% and 33.2% in East Harlem and Central Harlem.
Key numbers
38.0%of Manhattan adults are estimated to feel lonely always, usually or sometimesCDC PLACES county estimate for 2023; 95% range 34.4% to 41.5%. New York City: 38.5%.
7.6 pointsbetween the lowest and highest community district estimates (35.2% to 42.8%)Upper East Side and Upper West Side (35.2%) vs Central Harlem, Morningside and Hamilton Heights, and East Harlem (42.5% to 42.8%); averages of tract estimates weighted by adults.
26.3%of Manhattan adults are estimated to lack the social and emotional support they needThe lowest estimate of the five boroughs, but its 95% range overlaps those of Staten Island, Brooklyn and Queens. The Bronx: 34.4%.
44.1%in Chinatown and Two Bridges, among the highest of Manhattan’s neighborhoodsAlso among the highest for lacking support (37.9%). Among the lowest: Upper East Side-Carnegie Hill, 32.6% and 19.5%.
40.5%of Manhattan adults live in a census tract where the estimate is 40% or higherAbout 592,000 of 1,462,000 adults, across 127 of 304 tracts.
The map
Adults who feel lonely at least sometimes, by census tract, Manhattan, 2023
under 35%35% to 37.9%38% to 40.9%41% to 43.9%44% or moreno estimate, or under 200 adults
Each shape is a 2020 census tract; labels give the community district average. On a computer, hover over a tract to see its estimate; every tract is in the data download below. Source: CDC PLACES 2025 release (model-based estimates from 2023 survey data); tract shapes from NYC Planning. Governors, Liberty and Ellis Islands, which have no estimate, are not drawn.
By community district
The districts north of Central Park and on the Lower East Side had the highest estimates for both measures; the Upper East Side, the Upper West Side, Greenwich Village and East Midtown had the lowest.
Adults who feel lonely at least sometimes, by Manhattan community district, 2023
Central Harlem42.8%
Morningside Heights, Hamilton Heights42.6%
East Harlem42.5%
Lower East Side, Chinatown41.8%
Washington Heights, Inwood40.2%
Financial District, Tribeca38.4%
Midtown, Flatiron, Union Square38.1%
Chelsea, Hell’s Kitchen37.4%
East Midtown, Murray Hill37.0%
Greenwich Village, SoHo36.7%
Upper West Side35.2%
Upper East Side, Roosevelt Island35.2%
Manhattan (CDC county estimate)38.0%
Community district values are averages of CDC PLACES tract estimates, weighted by each tract’s adults. The pale bar is CDC’s own estimate for Manhattan as a whole.
Loneliness and lack of support by Manhattan community district, 2023
Community district
CD
Adults
Tracts
Feel lonely
Lack support
Central Harlem
10
105,674
25
42.8%
33.2%
Morningside Heights, Hamilton Heights
9
95,348
20
42.6%
30.4%
East Harlem
11
101,817
24
42.5%
32.6%
Lower East Side, Chinatown
3
144,186
31
41.8%
31.0%
Washington Heights, Inwood
12
151,894
29
40.2%
29.5%
Financial District, Tribeca
1
65,609
12
38.4%
24.6%
Midtown, Flatiron, Union Square
5
53,359
22
38.1%
25.0%
Chelsea, Hell’s Kitchen
4
118,052
23
37.4%
25.2%
East Midtown, Murray Hill
6
145,592
25
37.0%
22.9%
Greenwich Village, SoHo
2
83,858
20
36.7%
22.7%
Upper West Side
7
191,079
29
35.2%
22.7%
Upper East Side, Roosevelt Island
8
198,389
42
35.2%
21.7%
Marble Hill (part of Manhattan, in Bronx CD 8)
6,738
1
41.8%
31.9%
All Manhattan tracts (our average)
1,461,712
304
38.6%
26.5%
By neighborhood
Manhattan neighborhoods (NTAs with at least 5,000 adults), highest to lowest loneliness, 2023
Neighborhood
Community district
Adults
Feel lonely
Lack support
Chinatown-Two Bridges
Lower East Side, Chinatown
36,658
44.1%
37.9%
Harlem (North)
Central Harlem
67,049
43.9%
34.7%
Morningside Heights
Morningside Heights, Hamilton Heights
34,861
43.3%
28.3%
Manhattanville-West Harlem
Morningside Heights, Hamilton Heights
18,534
43.3%
32.6%
East Harlem (North)
East Harlem
51,415
43.1%
33.7%
East Harlem (South)
East Harlem
49,127
41.8%
31.2%
Hamilton Heights-Sugar Hill
Morningside Heights, Hamilton Heights
41,953
41.8%
31.3%
Marble Hill (Manhattan part of Kingsbridge-Marble Hill)
Bronx CD 8
6,738
41.8%
31.9%
Washington Heights (South)
Washington Heights, Inwood
61,369
41.4%
30.9%
East Village
Lower East Side, Chinatown
65,275
41.2%
27.5%
Harlem (South)
Central Harlem
38,625
40.9%
30.5%
Lower East Side
Lower East Side, Chinatown
42,253
40.8%
30.6%
Inwood
Washington Heights, Inwood
30,067
39.5%
29.2%
Washington Heights (North)
Washington Heights, Inwood
60,458
39.3%
28.2%
Midtown South-Flatiron-Union Square
Midtown, Flatiron, Union Square
29,996
39.0%
24.8%
Financial District-Battery Park City
Financial District, Tribeca
45,405
38.9%
24.7%
Gramercy
East Midtown, Murray Hill
26,480
38.5%
23.7%
Murray Hill-Kips Bay
East Midtown, Murray Hill
58,118
38.0%
23.6%
SoHo-Little Italy-Hudson Square
Greenwich Village, SoHo
21,104
37.9%
24.9%
Upper West Side-Manhattan Valley
Upper West Side
44,612
37.8%
25.8%
Hell’s Kitchen
Chelsea, Hell’s Kitchen
54,728
37.5%
25.6%
Chelsea-Hudson Yards
Chelsea, Hell’s Kitchen
63,324
37.4%
24.7%
Greenwich Village
Greenwich Village, SoHo
30,722
37.2%
22.6%
Tribeca-Civic Center
Financial District, Tribeca
20,204
37.1%
24.3%
Midtown-Times Square
Midtown, Flatiron, Union Square
23,363
37.0%
25.3%
Stuyvesant Town-Peter Cooper Village
East Midtown, Murray Hill
19,616
36.6%
22.2%
Upper East Side-Yorkville
Upper East Side, Roosevelt Island
72,494
36.2%
22.5%
Upper East Side-Lenox Hill-Roosevelt Island
Upper East Side, Roosevelt Island
73,811
36.0%
22.5%
West Village
Greenwich Village, SoHo
32,032
35.4%
21.3%
Upper West Side-Lincoln Square
Upper West Side
59,948
34.8%
22.1%
East Midtown-Turtle Bay
East Midtown, Murray Hill
41,378
34.8%
21.7%
Upper West Side (Central)
Upper West Side
86,519
34.1%
21.5%
Upper East Side-Carnegie Hill
Upper East Side, Roosevelt Island
52,084
32.6%
19.5%
Manhattan and the other boroughs
Manhattan’s loneliness estimate (38.0%) is close to the citywide figure (38.5%). Its estimate for lack of social and emotional support (26.3%) is the lowest of the five boroughs, though its 95% range overlaps those of Staten Island, Brooklyn and Queens; only the Bronx’s range (30.7% to 38.4%) sits fully above it.
The five boroughs and New York City: CDC’s own estimates with 95% ranges, 2023
Area
Feel lonely
Lack support
Manhattan
38.0% (34.4 to 41.5)
26.3% (23.2 to 29.4)
Brooklyn
36.3% (32.9 to 39.7)
30.5% (27.3 to 33.7)
Queens
38.2% (34.6 to 41.9)
31.9% (28.5 to 35.4)
Bronx
40.6% (36.7 to 44.7)
34.4% (30.7 to 38.4)
Staten Island
34.2% (30.2 to 38.2)
27.8% (24.3 to 31.3)
New York City
38.5% (36.5 to 40.5)
30.9% (29.2 to 32.7)
What this means
Loneliness is common in every part of Manhattan. Even in the districts with the lowest estimates, about one adult in three (35.2%) is estimated to feel lonely at least sometimes.
These numbers show where, not why. They come from a statistical model that combines a national health survey with each area’s population makeup, such as age, sex, and race and ethnicity. They do not show that a neighborhood, a living situation or a relationship causes loneliness.
CDC describes loneliness as the gap between the relationships a person wants and the ones they have (measure definition). So it is not the same as living alone, and people can feel it with a partner or family around them.
If loneliness has been weighing on you, talking it through can help. Individual therapy is one place to start, and couples counseling can help when distance has grown inside a relationship.
If you are in crisis or thinking about harming yourself, call or text 988 (the 988 Suicide & Crisis Lifeline) any time, or call 911.
How we did this
CDC’s PLACES project publishes model-based estimates of health measures for every U.S. county, city and census tract. Its 2025 release
uses 2023 survey data from the Behavioral Risk Factor Surveillance System (BRFSS). We used two measures: feelings of loneliness
(adults who report always, usually or sometimes feeling lonely) and lack of social and emotional support (adults who report
sometimes, rarely or never getting the social and emotional support they need). We used crude (not age-adjusted) prevalence throughout, because
that is the only kind PLACES publishes for tracts.
PLACES has estimates for 304 of Manhattan’s 310 census tracts (2020 boundaries). To group tracts into community districts and
neighborhoods, we used NYC Planning’s 2020 census tract file, which assigns each tract to a neighborhood tabulation area (NTA) and a community
district tabulation area (CDTA, NYC Planning’s tract-based version of a community district). Each district or neighborhood figure is the average
of its tract estimates, weighted by each tract’s adult population as listed in PLACES. CDC does not publish these district averages; they are our
calculation, and they have no confidence ranges of their own. The borough and city figures are CDC’s own estimates.
Limits
These are model estimates, not counts. CDC builds them from survey answers and population data (multilevel regression and
post-stratification), so tract differences mostly reflect who lives where. Single tracts carry more uncertainty than districts: tract
estimates range from 30.3% to 55.4%, and the highest is a tract with only 527 adults.
CDC models each geography separately, so our average of all Manhattan tracts (38.6%) does not match CDC’s county
estimate (38.0%). Compare districts with each other, and use CDC’s county figure for Manhattan as a whole.
The borough estimates for loneliness overlap within their 95% ranges, so the boroughs cannot be ranked with confidence on that measure.
For lack of support, Manhattan’s range (23.2% to 29.4%) sits fully below the Bronx’s
(30.7% to 38.4%) but overlaps those of Staten Island, Brooklyn and Queens, so that is the only clear-cut
borough comparison. The same applies to the neighborhood figures: neighboring values a few tenths of a point apart should be read as similar.
Six tracts have no estimate: parks, the United Nations tract, and the harbor islands. Two tracts with fewer than 200 adults (Central Park,
117 adults, and one Midtown tract) are shaded gray on the map. Central Park and Randall’s Island
(1,275 adults) are left out of the neighborhood table because they have
so few residents; Randall’s Island is included in East Harlem’s district average. Marble Hill is part of
Manhattan but belongs to a Bronx community district, so it has its own row.
Nothing here measures relationships, marital status or therapy use. The data cannot say whether couples, single people or any other group
feel lonelier.
Download the data:manhattan-loneliness-map.csv (every Manhattan tract with its neighborhood and district, district and neighborhood averages, and CDC’s borough and city estimates). Free to reuse under CC BY 4.0 with credit to spiral2grow and a link to this page.
Feeling disconnected?
Moshe Ratson, LMFT, MBA, is a licensed marriage and family therapist (New York license #000697) who works with individuals and couples in Midtown Manhattan, near Grand Central Station, and online by video. A free phone consultation is the first step.
Practicing psychotherapist and anger expert Moshe Ratson shows readers how to use their anger as a tool for personal transformation.
Anger Is Your Compass
Client Reviews
On the brink of divorce, spiral2grow therapist helped us save our marriage. We still have challenges, yet we are committed to handle them. Our therapist gave us the ability to create a healthy and happy marriage richer than either of us ever imagined. It was the hardest thing we have ever done, a... Couples Therapy
Moshe Ratson has become our resource in assisting our leaders to not only identify but correct and improve development areas. The coaching he has provided on an individual basis has given valuable insight and helped our staff gain perspective in terms of managing relationships, prioritizing, stra... Executive Coaching
It is great to to control the situation rather than be controlled by it. By applying the techniques that I have learned from your anger management classes, I am able to recognize my own negative self talk. Now, I am using your “formula” and taking the time to be patient, rational and consider the... Anger Management
Over six months ago, I felt helpless and depressed about my job situation and convinced that the only thing possible was a total career transition. Then, I started working with Moshe. Through difficult, yet rewarding experience, I have explored and identify my needs. Within a few weeks, I realize... Career Coaching
“I have worked with some of the very best leadership coaches in the United States. I can say without hesitation that Moshe not only stands among them at the level of tactics and problem-solving but he also brings a level of understanding and insight about living authentically as a human being tha... Life Coaching
You provided us with practical tools & strategies to improve our communication, problem-solving skills and intimacy. You helped us build the foundation for our marriage. Now, we feel that we are growing together in a loving committed relationship. Relationship Coaching
No program has ever offered me such good and applicable relationship counseling. This workshop should be a pre-requisite for marriage or intimate relationship. Although we were in a group setting, it was very personal and private. I leave this group feeling renewed with a new understanding of my ... Workshops